(更新日: 2017年8月18日 )
x軸とy軸で別々のデータを参照したい時があります。そんな時はpasteコマンドを使います。pasteはUnix系のコマンドですから、Windowsの場合はCygwinなどが必要です。
例えば次のようなデータを使います。一つめは各月のガス使用量、二つめは平均気温のデータです。
2014.03.27-2014.04.24	35
2014.04.25-2014.05.27	27
2014.05.28-2014.06.25	19
2014.06.26-2014.07.28	19
2014.07.29-2014.08.26	11
2014.08.27-2014.09.25	16
2014.09.26-2014.10.28	22
2014.10.29-2014.11.25	33
2014.11.26-2014.12.24	63
2014.12.25-2015.01.27	77
2015.01.28-2015.02.24	74
2015.02.25-2015.03.26	68
2015.03.27-2015.04.24	41
2015.04.25-2015.05.27	25
2015.05.28-2015.06.25	16
2015.06.26-2015.07.28	16
2015.07.29-2015.08.26	7
2015.08.27-2015.09.25	14
2015.09.26-2015.10.27	21
2015.10.28-2015.11.25	26
2015.11.26-2015.12.24	56
2015.12.25-2016.01.26	76
2016.01.27-2016.02.24	73
2016.02.25-2016.03.28	67
2016.03.29-2016.04.25	36
2016.04.26-2016.05.26	27
2016.05.27-2016.06.27	21
2016.06.28-2016.07.26	17
2016.07.27-2016.08.26	13
2016.08.27-2016.09.27	17
2016.09.28-2016.10.26	21
2014年4月 	14.6
2014年5月 	19.5
2014年6月 	24
2014年7月 	27.4
2014年8月 	27.1
2014年9月 	23.4
2014年10月 	18.9
2014年11月 	13.2
2014年12月 	5.4
2015年1月 	4.9
2015年2月 	5.7
2015年3月 	9.7
2015年4月 	15.2
2015年5月 	21.3
2015年6月 	22.3
2015年7月 	26.5
2015年8月 	28.1
2015年9月 	23.1
2015年10月 	18.4
2015年11月 	14.3
2015年12月 	9.3
2016年1月 	5.8
2016年2月 	6.5
2016年3月 	10.5
2016年4月 	15.9
2016年5月 	20.6
2016年6月 	22.9
2016年7月 	27
2016年8月 	28.6
2016年9月 	25.2
2016年10月 	19.7
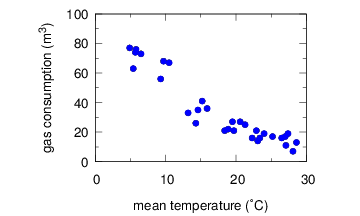
これらから平均気温とガス消費料の相関を調べたいとします。x軸に平均気温、y軸にガス使用量を参照してプロットしたいとする場合は
paste gas.dat temp.dat
として、データを結合します。gnuplotでは、このままリダイレクトで用いることができます。以下は一例です:
unset grid
set terminal pdfcairo enhanced color font "Helvetica,18"
set output "gas-temp.pdf"
set xlabel 'mean temperature ({/Symbol \260}C)' font "Helvetica,20"
set ylabel 'gas consumption (m^3)' font "Helvetica,20"
set size ratio 0.7
set tics font "Helvetica,20"
set xrange [:]
set yrange [:100]
set xtics 10
set mxtics 2
set ytics 20
set mytics 2

plot '< paste gas.dat temp.dat' using ($4):($2) title "" with points lc rgb "blue" pt 7 ps 1

unset terminal
なお、pasteで結合する際のデリミタは”-d “で指定できます。デフォルトはTABです。スペースが良い場合は
paste -d " " gas.dat temp.dat
とします。


