ちょっと前まではgnuplotで日本語文字列や日本語フォントを扱うのは苦労がありましたが、version 5.0以上からはだいぶ楽になっています。
gnuplot で日本語文字列や日本語フォントを扱うポイントは次のようなものです:
- スクリプトファイルを使う
- スクリプトファイルのコーディングをutf-8にする
- terminal には cairo系 を指定する
- 日本語を含むfontを指定する
目次
スクリプトファイルを使う
コンソールから入力するのは、なぜか上手くいきません。 スクリプトファイルを gnuplot に与えると日本語を表示できます。
スクリプトファイルのコーディングをutf-8にする
gnuplot のスクリプトファイルのコーディングをutf-8にします。
set encoding ut8
は無くても動くようですね。
terminal には cairo 系を指定する
cairo 系の terminal には以下のものがあります:
- pdfcairo
- pngcairo
- epscairo
- wxt
基本的にpdfcairo, pngcairo, epscairo, wxtの出力の見た目はほぼ同じです。
Linux 上だとイタリックが有効です。Windows(Cygwin)上では有効になりません(なぜかな…)。
日本語を含む font を指定する
細かいことを言うと、cairo系はfontconfig の仕組みでフォントにアクセスします (gnuplotのマニュアルから)。
fontの指定の例
fontのファイルやフォント名の指定のいずれでも良いようです:
font "VL PGothic,20"
font "VL-PGothic-Regular.ttf,24"
font "Meiryo,18"
fontconfig の仕組みを使っているので、fc-listでアクセスできるのが必要です。
CygwinでWindowsのフォントにアクセスできるようにするには、一例として
~% ln -s /cygdrive/c/Windows/Fonts /usr/share/fonts/windows
とします。/usr/share/fonts/にコピーしても良いです。お好みでどうぞ。
cairo 系とそれ以外の terminal の比較
pdf, png, eps はcairo系以外のterminalもありますので、比較してみます。
pdfcairo vs pdf
同じ結果です。エンジンは同じなのでしょうかね。
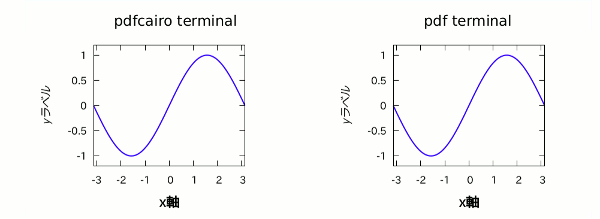
pdfcairo のソース
set terminal pdfcairo color font "VL PGothic,20" enhanced
set output "pdfcairo-test.pdf"
set xlabel '{/:Bold x軸}' font "VL-PGothic-Regular.ttf,24"
set ylabel '{/:Italic yラベル}'

set size ratio 0.8
set tics font "VL-PGothic-Regular.ttf,18"
set xrange [-pi:pi]
set yrange [-1.2:1.2]

set ytics 0.5

plot sin(x) title "" with lines \
     lc rgb hsv2rgb(0.7, 1, 1) lt 1 lw 3

unset terminal
pdfのソース
set terminal pdf color font "VL PGothic,20" enhanced
set output "pdf-test.pdf"
set xlabel '{/:Bold x軸}' font "VL-PGothic-Regular.ttf,24"
set ylabel '{/:Italic yラベル}'

set size ratio 0.8
set tics font "VL-PGothic-Regular.ttf,18"
set xrange [-pi:pi]
set yrange [-1.2:1.2]

set ytics 0.5

plot sin(x) title "" with lines \
     lc rgb hsv2rgb(0.7, 1, 1) lt 1 lw 3

unset terminal
pngcairo vs png
微妙に違います。pngの方が若干美しくないです(笑)。
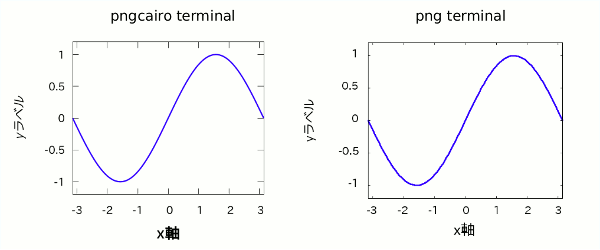
pngcairo のソース
set terminal pngcairo color font "VL PGothic,20" enhanced
set output "pngcairo-test.png"
set xlabel '{/:Bold x軸}' font "VL-PGothic-Regular.ttf,24"
set ylabel '{/:Italic yラベル}'

set size ratio 0.8
set tics font "VL-PGothic-Regular.ttf,18"
set xrange [-pi:pi]
set yrange [-1.2:1.2]

set ytics 0.5

plot sin(x) title "" with lines \
     lc rgb hsv2rgb(0.7, 1, 1) lt 1 lw 3

unset terminal
png のソース
set terminal png  font "VL PGothic,20" enhanced
set output "png-test.png"
set xlabel '{/:Bold x軸}' font "VL-PGothic-Regular.ttf,24"
set ylabel '{/:Italic yラベル}'

set size ratio 0.8
set tics font "VL-PGothic-Regular.ttf,18"
set xrange [-pi:pi]
set yrange [-1.2:1.2]

set ytics 0.5

plot sin(x) title "" with lines \
     lc rgb hsv2rgb(0.7, 1, 1) lt 1 lw 3

unset terminal
epscairo vs postscript (eps)
postscript terminalでは同じコマンドでは日本語が表示されません。
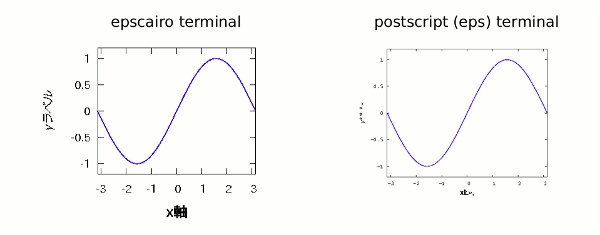
epscairoのソース
set terminal epscairo color font "VL PGothic,20" enhanced
set output "epscairo-test.eps"
set xlabel '{/:Bold x軸}' font "VL-PGothic-Regular.ttf,24"
set ylabel '{/:Italic yラベル}'

set size ratio 0.8
set tics font "VL-PGothic-Regular.ttf,18"
set xrange [-pi:pi]
set yrange [-1.2:1.2]

set ytics 0.5

plot sin(x) title "" with lines \
     lc rgb hsv2rgb(0.7, 1, 1) lt 1 lw 3

unset terminal
postscript (eps)のソース
set terminal postscript eps color font "VL PGothic,20" enhanced
set output "eps-test.eps"

set xlabel '{/:Bold x軸}' font "VL-PGothic-Regular.ttf,24"
set ylabel '{/:Italic yラベル}'

set size ratio 0.8
set tics font "VL-PGothic-Regular.ttf,18"
set xrange [-pi:pi]
set yrange [-1.2:1.2]

set ytics 0.5

plot sin(x) title "" with lines \
     lc rgb hsv2rgb(0.7, 1, 1) lt 1 lw 3

unset terminal