gnuplot 5.0からはhsv2rgbというbuilt-in functionが準備されています。hsv2rgb(h, s, v)の引数は全て[0:1]の範囲で定義されています。 (gnuplot 4.6以前はこの関数は定義されていないので、自前で関数を準備する必要があります。下の参考ページを参照して下さい。)
色相値 h (Hue)は0が赤(red)のようです。hsvの各値は下の環状HSV色空間に書き込んでみました。
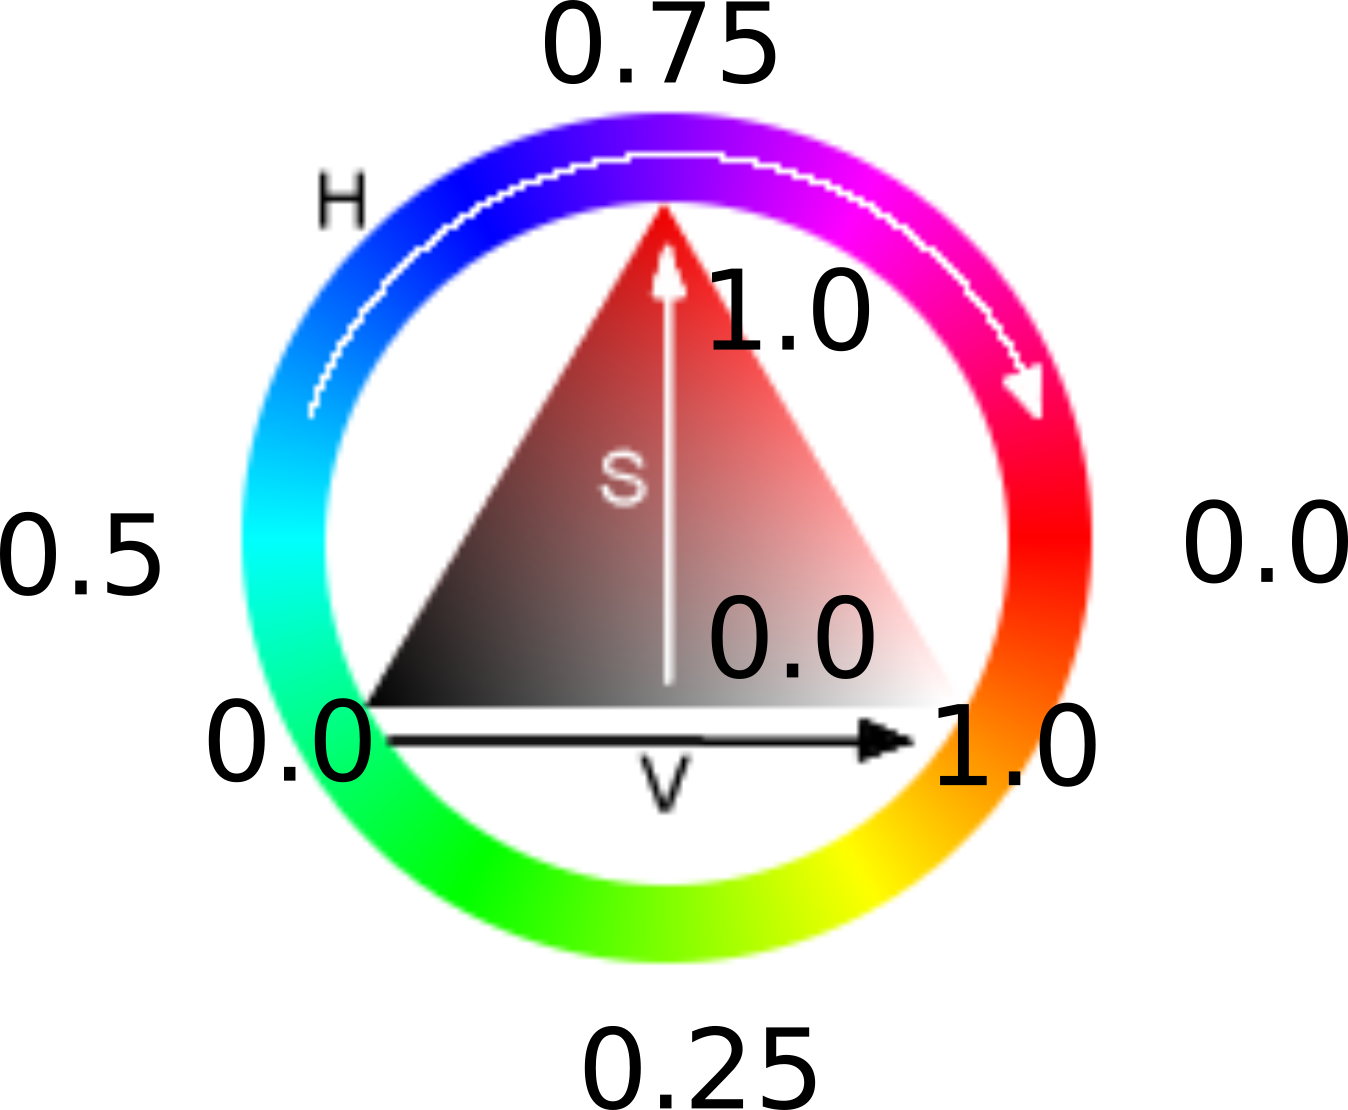
(この画像は https://commons.wikimedia.org/wiki/File:Hsv_sample.png を加工したものです。ライセンスはオリジナルの画像と同じ Creative Commons Attribution-Share Alike 3.0 Unported licenseです。)
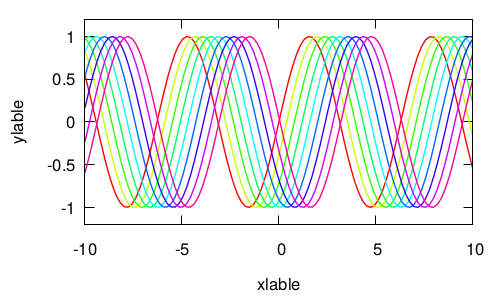
set terminal pdfcairo enhanced color font "Helvetica,18"
set output "hsv2rgb-1.pdf"
set xlabel 'xlable'
set ylabel 'ylable'
set xrange [:]
set yrange [-1.2:1.2]
set ytics 0.5

plot sin(x)      title "" with  lines lc rgb hsv2rgb(0,1,1) lt 1 lw 2,\
     sin(x-0.4)  title "" with  lines lc rgb hsv2rgb(0.2,1,1) lt 1 lw 2,\
     sin(x-0.8)  title "" with  lines lc rgb hsv2rgb(0.3,1,1) lt 1 lw 2,\
     sin(x-1.2)  title "" with  lines lc rgb hsv2rgb(0.4,1,1) lt 1 lw 2,\
     sin(x-1.6)  title "" with  lines lc rgb hsv2rgb(0.5,1,1) lt 1 lw 2,\
     sin(x-2.0)  title "" with  lines lc rgb hsv2rgb(0.6,1,1) lt 1 lw 2,\
     sin(x-2.4)  title "" with  lines lc rgb hsv2rgb(0.7,1,1) lt 1 lw 2,\
     sin(x-2.8)  title "" with  lines lc rgb hsv2rgb(0.8,1,1) lt 1 lw 2,\
     sin(x-3.2)  title "" with  lines lc rgb hsv2rgb(0.9,1,1) lt 1 lw 2,\

unset terminal
参考: Gnuplot Line Color in HSV (Hue, Saturation, Value) Model (stackoverflow)


