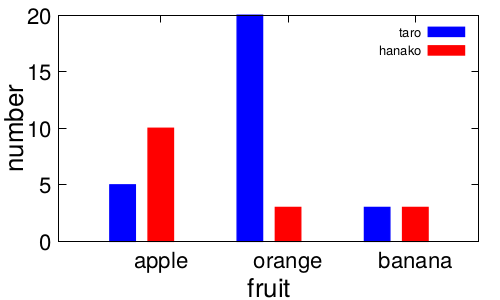
gnuplotで棒グラフを作成する方法はいくつかありますが、ここではboxesを使う場合を書きます。
histogram-data.datは次のようなファイルです。
person taro hanako
apple  5  10
orange 20 3
banana 3  3
二つの棒グラフを並べる時はusingのx軸参照で細工をします。行番号参照の変数$0を使って、それにオフセットを加えています。
x軸の値はxitc(1)で呼び出します。ここでは二番目のプロットで呼び出すことで位置の調整をしています。
unset grid
set terminal pdfcairo enhanced color font "Helvetica,14"
set output "histogram-boxes.pdf"
set xlabel 'fruit' font "Helvetica,28"
set ylabel 'number' font "Helvetica,28"
set tics font "Helvetica,25"
set xrange [:]
set yrange [0:]

set style data  point
set style fill solid
set boxwidth 0.2 relative

plot 'histogram-data.dat' skip 1 using ($0-0.1):($2) title "taro" with  boxes lc rgb "blue",\
     'histogram-data.dat' skip 1 using ($0+0.2):($3):xtic(1) title "hanako" with  boxes lc rgb "red"

  unset terminal
参考にしたページ: gnuplotで棒グラフを書く