(更新日: 2025年8月31日 )
gnuplotで軸に平行な線を引く方法を解説する。
なお以下の内容はGNUPLOT 6.0 patchlevel 3で確認している。
目次
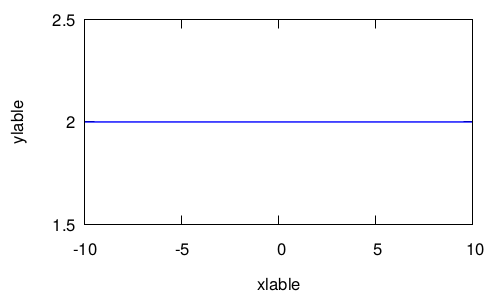
x軸に平行な線(水平線)を引く場合
これはかなり簡単で、定数の関数を定義してやれば良い。
unset grid
#set terminal pdfcairo enhanced color font "Helvetica,18"
set terminal pngcairo enhanced color font "Helvetica,18" size 640,480
set output "x-axis2.png"
set xlabel 'xlabel'
set ylabel 'ylabel'
set xrange [:]
set yrange [:]
set ytics 0.5
set pointsize 2
f1(x) = 2.0
plot f1(x)  notitle  with  lines lc rgb "blue" lt 1 lw 2
unset output
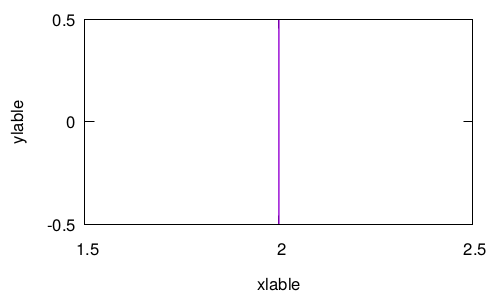
y軸に平行な線(垂直線)を引く場合
媒介変数を使う方法と、愚直にarrowを使う方法がある。
媒介変数を使う方法
unset grid
#set terminal pdfcairo enhanced color font "Helvetica,18" size 640,480
set terminal pngcairo enhanced color font "Helvetica,18" size 640,480
set output "y-axis-1.png"
set xlabel 'xlabel'
set ylabel 'ylabel'
set xrange [:]
set yrange [:]
set xtics 0.5
set ytics 0.5
set parametric
set trange [-0.5:0.5]
cnst = 2
plot cnst,t with lines title "" lw 2

unset output
arrowを使う場合
arrowを使う場合は、軸に平行な線だけでなく任意の線を引くことができる。
unset grid
# set terminal pdfcairo enhanced color font "Helvetica,18"
set terminal pngcairo enhanced color font "Helvetica,18" size 640,480
set output "arrow2.png"
set xlabel 'xlable'
set ylabel 'ylable'
set xrange [:]
set yrange [0:4]
set ytics 1.0
f1(x) = 2.0
# from first 2, graph 0 = 始点。x は一次軸の実座標(first)で 2、y はグラフ相対座標(graph)で 0=プロット枠の下端
# to   first 2, graph 1 = 終点。x は同じく 2、y は graph 1=プロット枠の上端。
set arrow 2 from  first 2, graph 0 to first 2, graph 1 nohead  lw 2 dt (10,6) lc rgb "red"

plot f1(x)  title "" with  lines lc rgb "blue" lt 1 lw 2
unset output
![]()
まとめ
上記の手法をまとめると以下の通り:
| 手法 | コメント |
|---|---|
| 定数関数 (水平) | 簡単/凡例不要/範囲外に伸ばすには工夫が必要 |
| parametric (垂直) | 学習コスト小/軸変更で長さが変わる |
| arrow + graph/first (水平・垂直) | 最も頑健/凡例は出ない/線スタイルで管理 |