(更新日: 2025年1月29日 )
MATLABでグラフを作る時によく使うコマンドをまとめてみた。
(随時追加していこうかと思っているが…。)
目次
グラフを重ねる
複数のグラフをプロットさせる場合の基本。hold on hold off
例
%%
t = 0:pi/100:4*pi;

f_h = figure(1);
plot(t, sin(t))
hold on
plot(t, cos(t))
hold off
グラフのフォントの変更
ax = gca;
ax.FontSize = 14;
ax.FontName = "Arial";
例
%%
t = 0:pi/100:4*pi;

f_h = figure(1);
plot(t, sin(t))
hold on
plot(t, cos(t))
hold off
ax = gca;
ax.FontSize = 14;
ax.FontName = "Arial";
タイル状に配置する
以前はsubplotを使う方法のみだったが、R2019bからはtiledlayoutを使える。
tiledlayoutでは以下の設定が使えるようになっている(subplot: 代替機能):
- プロット間およびレイアウトの縁周辺の間隔の制御
- レイアウトの上部に共有タイトルを表示するためのオプション
- x 軸と y 軸の共有ラベルを使用するためのオプション
- タイル配置を固定サイズとするかリフロー可能な可変サイズとするかを制御するオプション
tiledlayout
nexttile
例
%%
t = 0:pi/100:4*pi;

f_h = figure(1);
t1 = tiledlayout(2,1);
nexttile
plot(t, sin(t))
nexttile
plot(t, cos(t))
タイル状に配置したときの全体のタイトル
t = tiledlayout
title(t, "Title for all")
例
%%
t = 0:pi/100:4*pi;

f_h = figure(1);
t1 = tiledlayout(2,1);
t1.Title.String = "sine and cosine";
t1.Title.FontSize = 14;
t1.Title.FontName = "Arial";
%
st1 = nexttile;
plot(t, sin(t))
st1.FontSize = 14;
st1.Title.String = "sin(x)";
%
st2 = nexttile;
plot(t, cos(t))
title("cos(x)")
左右独立のy軸を使う
yyaxis left
yyaxis right
例
t = 0:pi/100:4*pi;

f_h = figure(1);
yyaxis left
plot(t, sin(t))
yyaxis right
plot(t, tan(t), '.')
ylim([-10 10])
プロットでのデフォルトの色
MATLABで既定の色がある。原色より若干調整して柔らかめなのでこれらを使いたい時がある。
plot: Color – ラインの色から引用している。
RGB 3 成分 16 進数カラー コード 外観 [0 0.4470 0.7410]'#0072BD'[0.8500 0.3250 0.0980]'#D95319'[0.9290 0.6940 0.1250]'#EDB120'[0.4940 0.1840 0.5560]'#7E2F8E'[0.4660 0.6740 0.1880]'#77AC30'[0.3010 0.7450 0.9330]'#4DBEEE'[0.6350 0.0780 0.1840]'#A2142F'
グラフ全体のサイズ調整
f_h = figure(1);
f_h.Postion = [x0, y0, with, height];
x0, y0はグラフの左下の位置で、プライマリディスプレイの左下隅から測ったピクセル数になる。
例
%%
t = 0:pi/100:4*pi;

f_h = figure(1);
yyaxis left
plot(t, sin(t))
yyaxis right
plot(t, tan(t), '.')
ylim([-10 10])

f_h.Position = [-1000, 200, 600, 600];
legendを2列以上で表示させる
複数の行・列で構成される凡例(legend)を作成できますか? – MATLAB Answers – MATLAB Centrallgd = legend; lgd.NumColumns = 2; % 凡例の列数を指定
surfでz軸に対数を使う
How to scale logarithmic in surface plot? – MATLAB Answers – MATLAB Central
surf(hoge)
ax = gca;
ax.ZScale   = 'log';
軸の目盛をなくす
2024-12-03追記
ax = gca;
ax.XTick = [];
ax.YTick = [];
右と上の軸をなくす
2024-12-03追記
ax = gca;
ax.Box = "off";
一部を拡大したグラフを挿入する
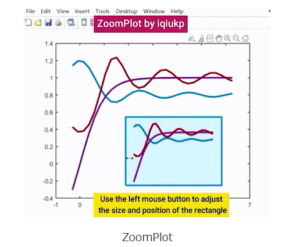
ZoomPlotを使うのが楽。
ZoomPlotのページのスクリーンショット:

下記の2行を追加すれば良い:
% add a zoomed zone
zp = BaseZoom();
zp.run;
上記を実行するとマウス操作の入力待ちになる。 以下の2回のマウス操作が必要:
- 拡大グラフを配置する場所の指定(右クリックで確定)
- 拡大する元のグラフの範囲を指定(右クリックで確定)


