gnuplot では異なる複数のデータ区切り(seprator)を同時に指定できます。 ですから、カンマ区切りのデータ(csv)ファイルとスペース区切りのデータファイルを同時にプロットできます。
説明が gnuplot manual “set datafile separator” (gnuplot 5.0だと116ページ)にあります。
↓の議論によればversion 4.6のどこかで複数のセパレーター(区切り)をサポートしたようです。
https://stackoverflow.com/questions/14262760/plotting-from-two-data-sets-delimited-two-different-ways
例えば
set datafile separator " ,"とすれば、” “と”,”のどちらかがあれば、それがセパレーターになります。
set datafile separator "\t ,"とすれば, ” “, “,”, “\t”(TAB)のどれかがあればセパレーターになります。
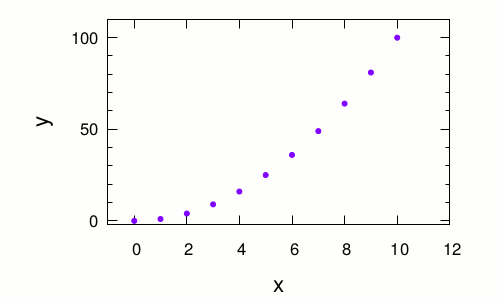
あまり現実的ではないですが、一つのデータファイル中で区切りがバラバラでもプロットできます。例えば
0,0
1 1
2,4
3 9
4,16
5 25
6,36
7 49
8 64
9,81
10 100
のような区切りがスペースとカンマの混じったデータでもOKです。
set terminal pdfcairo color enhanced font "Helvetica,18"
set output "separator-test.pdf"
set xlabel 'x' font "Helvetica,24"
set ylabel 'y' font "Helvetica,24"

set size ratio 0.6
set tics font "Helvetica,18"
set xrange [-1:12]
set yrange [-2:110]

set xtics 2
set ytics 50
set mytics 5

set datafile separator " ,"

plot 'separator-test.dat' using ($1):($2) title "" with points \
     lc rgb hsv2rgb(0.75, 1, 1) pt 7 ps 0.6

unset output